KAUFMAN COUNTY, Texas — Two highways that traverse Kaufman County are among the Top 50 dangerous highways in America, according to a recent study — U.S. Highway 175 and Interstate Highway 20.
KAUFMAN COUNTY, Texas — Two highways that traverse Kaufman County are among the Top 50 dangerous highways in America, according to a recent study — U.S. Highway 175 and Interstate Highway 20.
The study, conducted by ValuePenguin and published on July 28, 2018, analyzed crash data from 2010 to 2016 from the National Highway Traffic Safety Administration's Fatality Analysis Reporting System. Additional rating information found below.
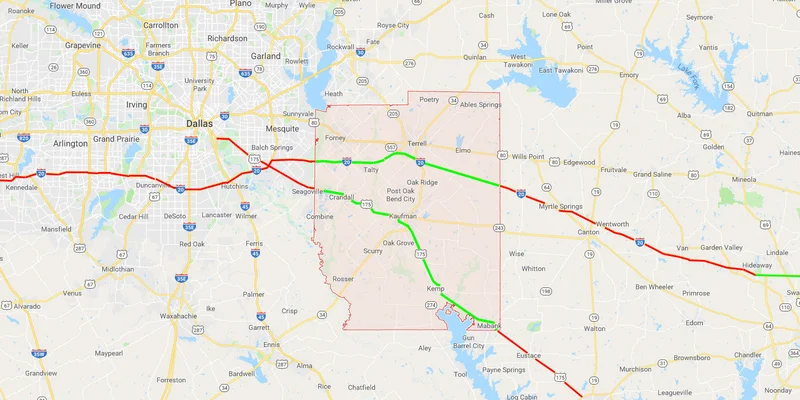
Interstate Highway 20, which consists of 636 miles of roadway in Texas, approximately 34 miles of which are in Kaufman County, was ranked at No. 6 on the Top 50 Most Dangerous Highways in the US.
U.S. Highway 175, which consists of 111 mils of roadway, all of which are in Texas and approximately one-third, or 37 miles, of which are in Kaufman County, was ranked at No. 42.
Dallas County accounted for the most deadliest county among the seven-year period on the three North Texas highways which made the list — Interstate 20 with 594 fatalities in 490 crashes, U.S. Highway 175 with 89 fatalities in 74 crashes, and Interstate 35 with 644 fatalities in 590 crashes which ranked No. 20.
Interstate 20 was ranked No. 5 amongst the Top 50 Deadliest Highways where fatal crashes involved drunk drivers with blood alcohol content (BAC) levels above 0.08 percent. On average, according to ValuePenguin, 28.7 percent of all fatal crashes that occurred on state routes or highways involved a legally drunk driver.
U.S. Highway 175 was ranked No. 17 in fatal crashes involving a legally drunk driver with 34.5 percent and Interstate 35 was ranked No. 14 with 39.5 percent.
Additional rating information from ValuePenguin:
"To rank the country's most dangerous roads, we filtered out roads that had fewer than 50 fatal crashes in this seven-year period and developed a grading system that utilized the following three factors: fatal crashes per vehicle-miles-traveled (VMT) per capita, fatalities per crash and the percentage of fatal nonvehicle collisions that occurred on each highway. Fatal crashes per VMT per capita allowed us to take local ridership into account, fatalities per crash allowed us to see where the deadliest crashes occur on average, and the percentage of fatal nonvehicle collisions allowed us to take into account safety risks on each road that don't result from dealing with other drivers. All three factors were normalized using minimum-maximum scaling and were given an equal weighting of 33%."